IVIVR
versus IVIVC
James E. Polli,
Ph.D.
University of Maryland School of Pharmacy, Baltimore MD
It is natural to try to relate in vitro
dissolution data to in vivo pharmacokinetic data. An effort to
connect dissolution and pharmacokinetic results is often referred
to as "in vitro-in vivo correlation" (IVIVC) analysis.
Over the last 40 years, three often-used approaches to perform
IVIVC are the so-called Level A, Level B, and Level C approaches
(1). Among these three, Level A is generally viewed as the best
method, since Level A utilizes all dissolution and pharmacokinetic
data. Level B also utilizes all dissolution and pharmacokinetic
data, but arguably is less insightful and helpful.
Level A IVIVC
and its Failure for Immediate Release
For Level A analysis, the fraction drug absorbed (Fa) is plotted
against the fraction drug dissolved (Fd). The fraction drug absorbed
profile is obtained by deconvoluting the plasma profile. Deconvolution
is essentially a back calculation to answer the question: "What
must the drug absorption profile have been, given the plasma profile?"
Of course, deconvolution requires some assumptions. The often
sought out Level A profile is a
one-to-one relationship between absorption and dissolution, with
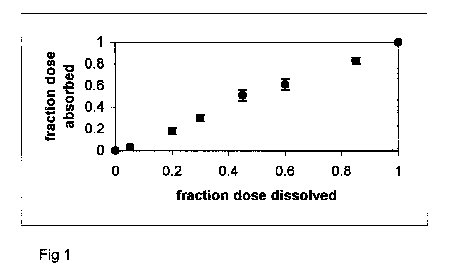
slope equal to one and y-intercept of zero. Figure 1 presents
a practically ideal Level A result.

Figure 1. Fa versus Fd profile
for diltiazem HCl ER capsules.
Release is rate-limiting, resulting in a linear profile
(i.e. Level A IVIVC).
So why has the relationship in
Figure 1 been a Holy Grail over the last 30 years? The simple
answer lies in the fact that alternative methods are more difficult,
and were practically unavailable 30 years ago. Level A analysis
requires linear regression of Fa against Fd. Linear regression
was (and still can be) easily performed by hand. The first commercially
available computers provided linear regression software. Hence,
given its advantages over Level B and Level C, along with the
computational availability to perform linear regression, Level
A analysis had become the preferred method to relate in vitro
dissolution to in vivo pharmacokinetics.
A statistic from Level A analysis
is r, the correlation coefficient. Its square, r2, ranges from
zero to one and is a measure of the strength of relationship between
Fa against Fd. Often, results with sufficiently large r2 (e.g.
greater than 0.9) yielded "a (successful) correlation."
An r2 value that was too low resulted in a "no correlation"
conclusion.
From this type of analysis, the
term in vitro-in vivo correlation (IVIVC) evolved. Numerous IVIVC
studies are in the literature. Controlled release products, rather
than immediate release products, are the focuses in the IVIVC
literature. Similarly, compendial and regulatory guidance (1,2)
has been provided for controlled release products. IVIVC analysis
for controlled release products is well accepted. Notable is that
IVIVC analysis for immediate release products have been less successful
(1). This disappointment with immediate release products has perhaps
resulted in a generally low expectation for IVIVC success for
immediate release products, including the questioning of the appropriateness
of subjecting immediate release products to IVIVC.
A reason for this lack of success
and acceptance may be the general failure of the Level A method
to immediate release products. As noted above, Level A has traditionally
been the most common IVIVC approach and requires a linear(ized)
relationship between fraction drug absorbed and fraction drug
dissolved.
However, this reason to reject
IVIVC analysis for immediate release products is poorly founded.
Since only products with dissolution rate-limited absorption (and
with complete absorption) can be expected to exhibit a Level A
plot with a slope of one and zero intercept (3), immediate release
products will "fail" the Level A method, as generally
is the case (1). Only products with significantly dissolution
rate-limited absorption (and essentially complete absorption)
will exhibit an IVIVC plot that fits the Level A description [e.g.
Fig. 1] (3).
The intrinsic inability of immediate
release products to conform to a Level A "straight line"
appearance does not indicate that dissolution from such products
fails as a surrogate for bioavailability. Also, the "failure"
of immediate release products to exhibit dissolution rate-limited
absorption should not infer that immediate release products are
inappropriate candidates for other more relevant forms of IVIVC
analysis (i.e. non-linear forms of IVIVC). Of course, the relevance
of a dissolution test needs to be defendable in terms of the mechanism
of drug release from the dosage form, including the role of physicochemical
and physiologic factors (4).
The Slippery
Slope of "Correlation"
So what are more relevant forms of IVIVC, that may apply to immediate
release (IR)? Since dissolution is perhaps not rate-limiting in
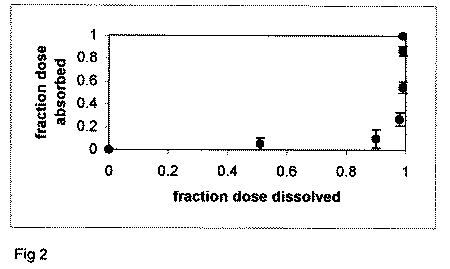
an IR product, the Fa against Fd profile will be non-linear. Figure
2 plots the Fa versus Fd profile for an IR product. Points in
the profile do not follow the line of unity (i.e. Level A profile),
but rather well below it, since absorption cannot "keep up"
with dissolution.

Figure 2. Fa versus Fd profile
for enalapril maleate tablets. Dissolution is more rapid than
overall absorption, resulting in a non-linear profile.
Why might we feel uncomfortable
with such a plot? Some dissatisfaction may arise from our expectation
of an IVIVC. In IVIVC, "C" denotes "correlation",
which is defined as "the degree of relationship between two
variables" (5). Correlation deals with the "tightness"
in how two variables vary together. This term does not limit a
relationship to only the linear type, but allows for non-linear
relationships as well.
However, the most simple relationship
(and thus the most appropriate to consider first) is the linear
relationship. When one speaks of correlation, a linear relationship
is immediately considered and inspected for. In practice, correlation
is often taken to imply a linear relationship. For IR products,
this limitation is problematic. Arguably, avoidance of the word
"correlation" and the use of a more general term that
would allow for non-linear relationships may aid in the development
of IVIVC-type analysis of IR products.
IVIVR
One possible substitution for IVIVC is IVIVR, with "R"
denoting "relationship." By comparison with Level A
IVIVC, IVIVR analysis would concern the
elucidation of the in vitro dissolution - in vivo absorption relationship.
Hence, IVIVR need not be limited to straight-line relationships,
which appear to be generally incorrect for IR products (1,6,7).
One intent of IVIVR should be to learn about the relative contribution
of dissolution to a product's overall absorption kinetics.
One model for IVIVR is (3):
 eq 1
eq 1
where
Fa
is the fraction of the total amount of drug absorbed at time t,
fa
is the fraction of the dose absorbed at t = #,
a
is the ratio of the apparent first-order permeation rate constant
(kpaap) to the first-order dissolution rate constant (kd), and
Fd is the fraction of drug dose dissolved at time t.
Of note is that the Level A method
is a special (linear) case of eq 1. If fa = 1.0 (i.e. complete
absorption) and a>>1# (i.e. strongly dissolution rate-limited
absorption), then Fa = Fd, as in Fig 1.
This IVIVR analysis has been applied
to several formulations of metoprolol, piroxicam, and ranitidine
(6,7). IVIVR analysis indicated that formulation properties and
drug substance biopharmaceutic properties influenced the degree
to which dissolution controlled overall absorption kinetics. Interestingly,
dissolution was not rate-limiting from even the slowest dissolving
IR formulations for the high solubility drugs.
Future Directions
The use of the term IVIVR rather than IVIVC is preferred. Immediate
release products are amenable to dissolution-absorption analysis.
However, the term IVIVR itself is neither new (8), nor fundamental.
Rather, what is needed is a better understanding of in vivo dissolution,
and its in vitro surrogate, the dissolution test. Additionally,
dissolution needs to be considered in the context of other parallel
and sequential processes (e.g. permeability, degradation, and
transit). Through a better understanding of dissolution, dissolution
and IVIVR can facilitate not only SUPAC-type changes, but also
facilitate drug product development.
References
1. USP 23-NF 18; United States Pharmacopeial Convention, Inc.,
Rockville, MD, 1994.
2. Extended Release Solid Oral Dosage Forms: Development, Evaluation,
and Application of In Vitro/In Vivo Correlations, Center for Drug
Evaluation and Research, Food and Drug Administration, September,
1997.
3. J.E. Polli, J.R. Crison, and G.L. Amidon, Novel approach to
the analysis of in vitro-in vivo relationships, J. Pharm. Sci.
85, 753-760 (1996).
4. E. Galia, E. Nicolaides, D. Horter, R. Lobenberg, C. Reppas,
and Dressman JB, Evaluation of various dissolution media for predicting
in vivo performance of class I and II drugs. Pharm Res. 15, 698-705
(1998).
5. Kachigan, S.K. Multivariate Statistical Analysis; Radius Press,
New York, 1991.
6. J.E. Polli, G.S. Rekhi, L.L. Augsburger, and V.P. Shah, Methods
to compare dissolution profiles and a rationale for wide dissolution
specifications for metoprolol tartrate tablets, J. Pharm. Sci.
86, 690-700 (1997).
7. J.E. Polli and M.J. Ginski, Human drug absorption kinetics
and comparison to Caco-2 monolayer permeabilities, Pharm. Res.
15, 47-52 (1998).
8. J. Devane and J. Butler. The impact of in vitro-in vivo relationships
on product development, Pharm. Tech. 21,146-159 (1997).


 eq 1
eq 1